30 days, risk-free. Full platform access. Cancel anytime — no card required to start.Start trial →
Volatility-Based Market Intelligence

Forecast support, resistance, trend, and implied volatility.

MetaSwing delivers institutional-grade market analytics built around Volatility-Based Support Resistance (VBSR) — a quantitative methodology to forecast future price turning points, trend continuation, risk levels, and implied volatility reversals.

Traditional technical analysis focuses on price. MetaSwing focuses on volatility — the core input driving institutional risk models, derivatives pricing, and modern market microstructure.
No credit card Equities · FX · Futures Timeframe agnostic
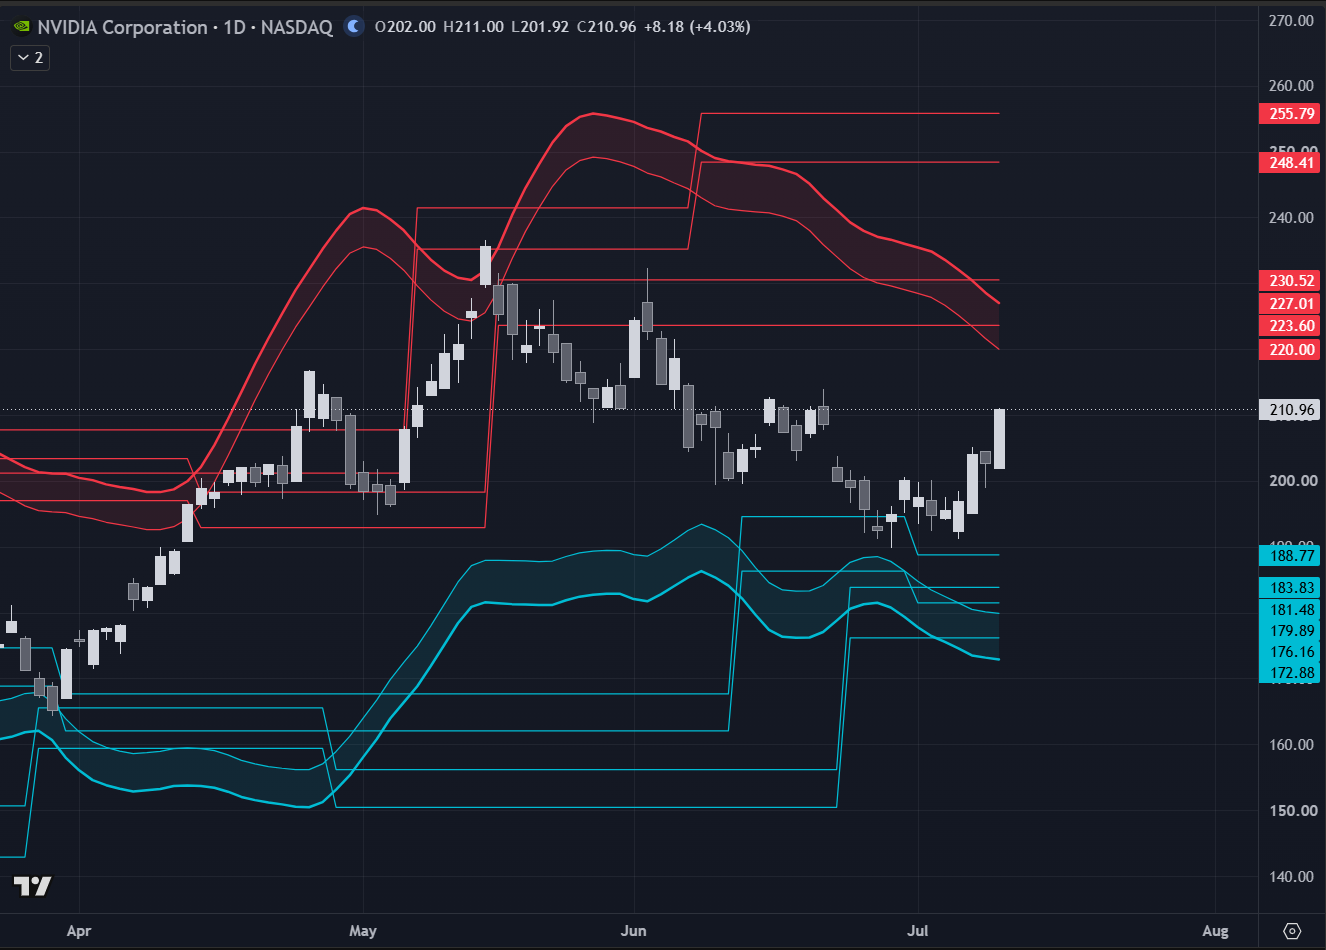
MetaSwing N Bands and support/resistance levels on an NVDA daily chart
NVDA · Daily — MetaSwing N Bands and SR Levels
Multi-asset coverage
US EquitiesETFs & IndicesMajor FX PairsFuturesCrypto Majors
Why MetaSwing

Align your decisions with the forces that actually move markets.

MetaSwing was developed to help traders, analysts, portfolio managers, and risk professionals align their decisions with the same volatility-driven forces influencing institutional market behavior.

MetaSwing helps you
  • Identify high-probability support and resistance zones
  • Measure short-term risk versus long-term reward
  • Detect implied volatility mean-reversion opportunities
  • Evaluate asymmetric reward-to-risk setups
The MetaSwing advantage

Map algorithmic turnarounds

Locate the exact support and resistance floors where institutions are structurally forced to buy or sell.

Timeframe-agnostic performance

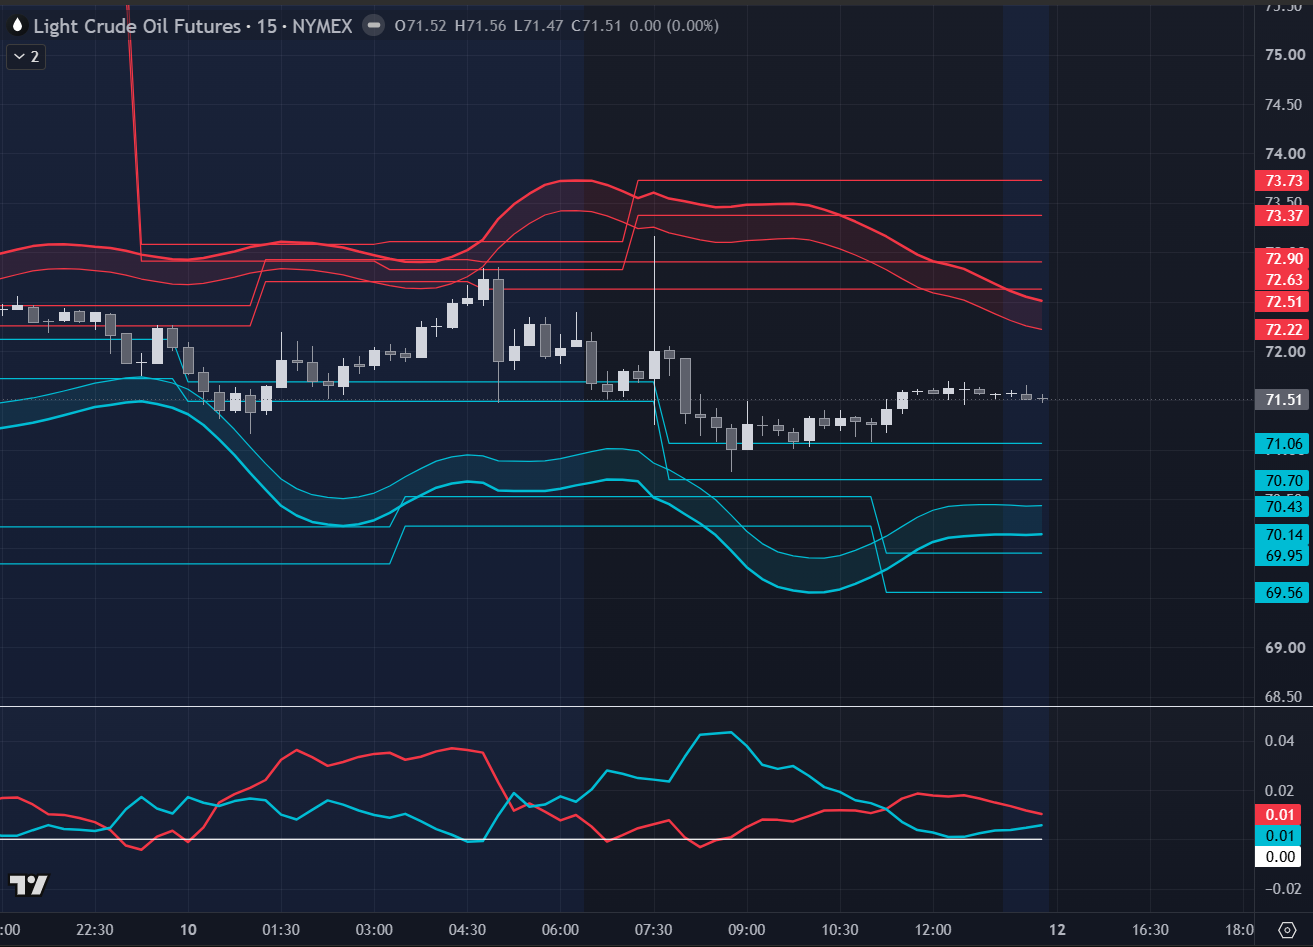
Proprietary calculations work with identical rules whether you day trade 15-minute intervals or swing trade weekly bars.

Features & how it works

The power of price containment.

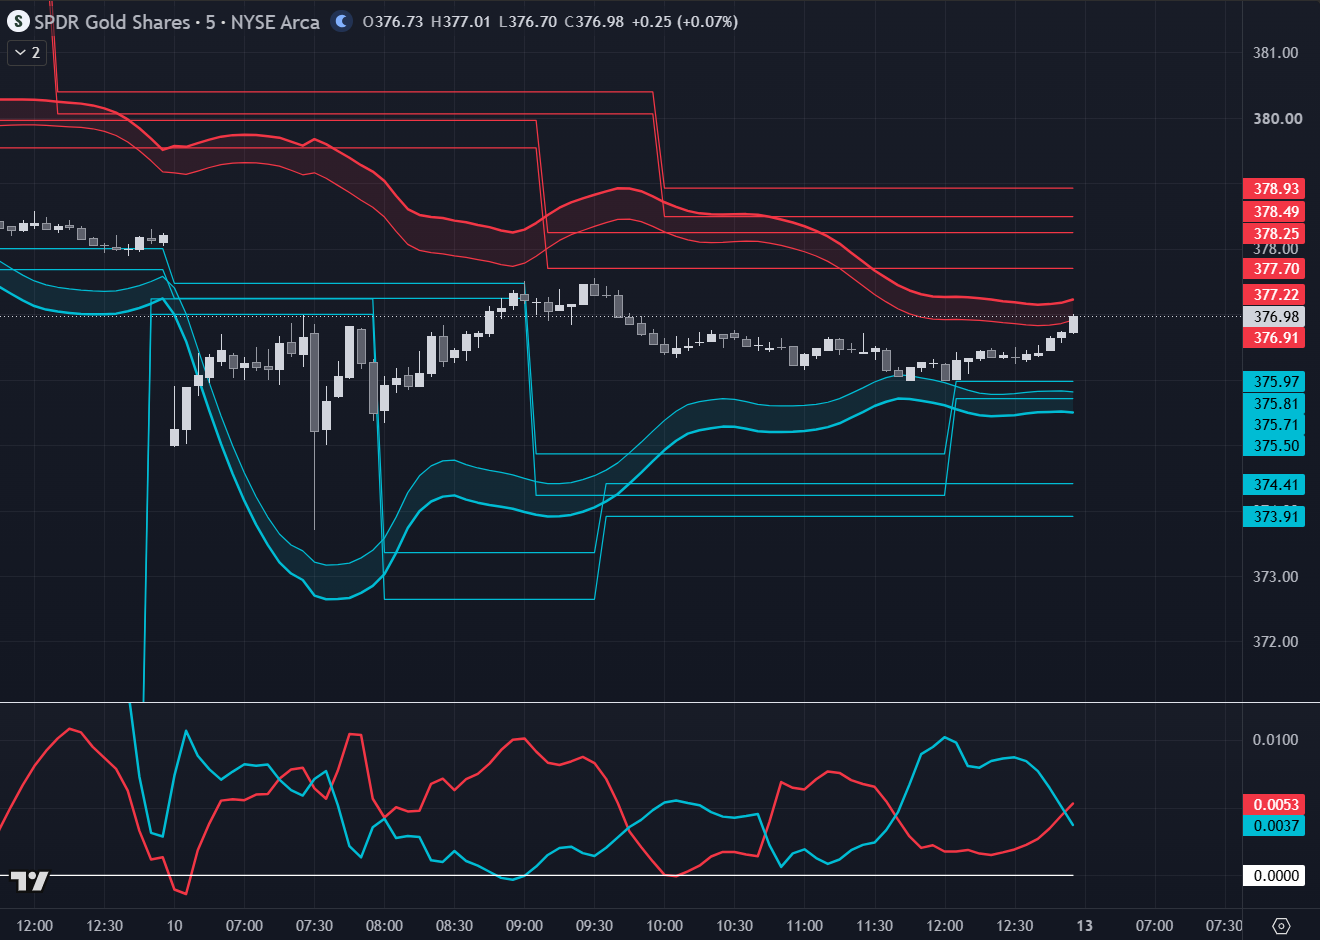
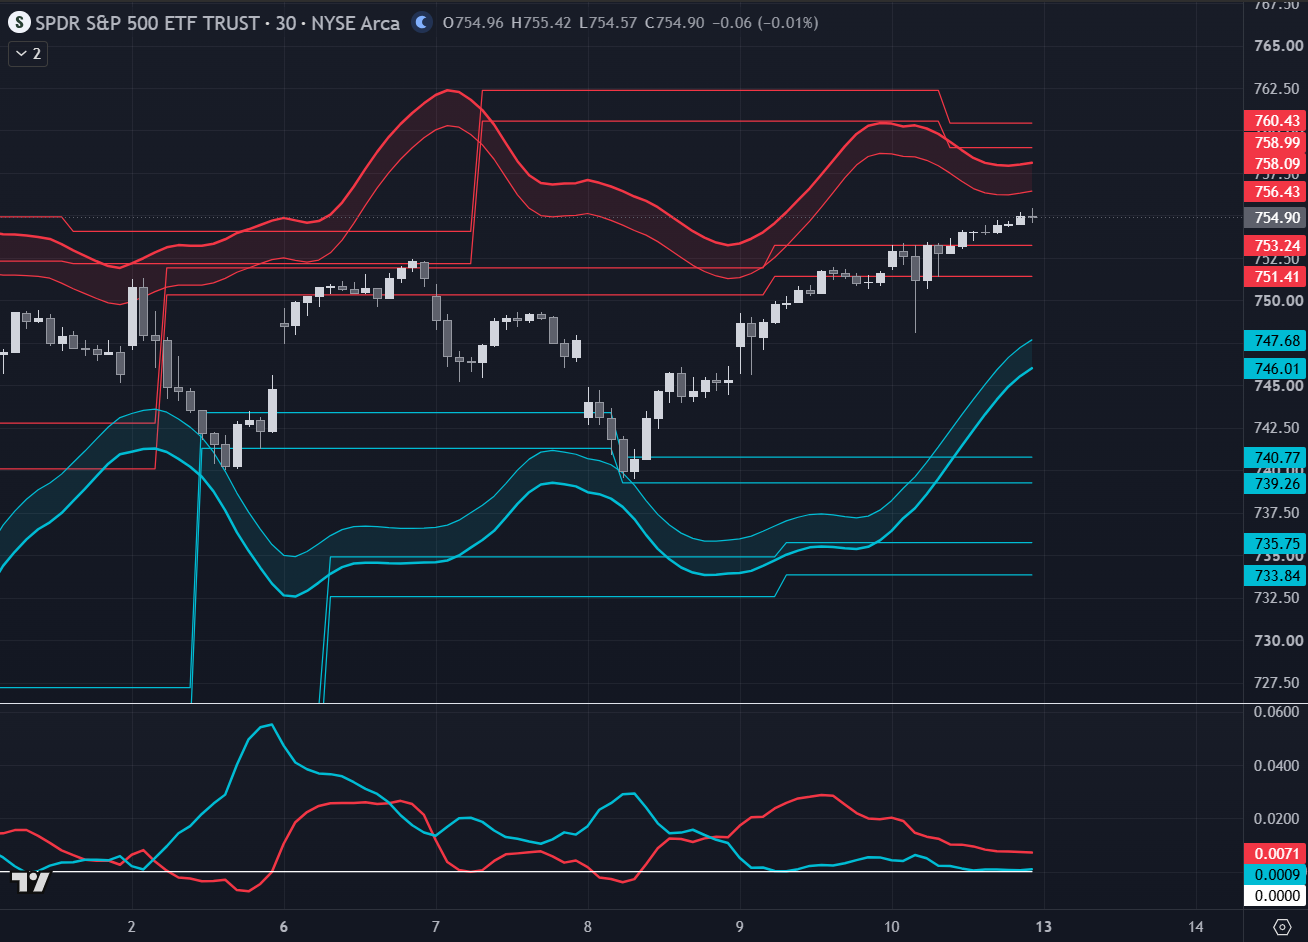
Standard trading bands, such as Bollinger bands or Keltner bands, merely guess at an asset's speed and momentum. MetaSwing N Bands serve a completely different purpose — they are built to contain price.

MetaSwing N Bands containing price on a SPY 30-minute chart
SPY · 30 min — N Bands containing price between institutional support and resistance
01

Dynamic Support & Resistance (SR) Lines

When price descends to the lower MetaSwing Band, it encounters institutional buying power. When it strikes the upper band, it meets a wall of selling pressure.

02

Projected Implied Volatility (PIV)

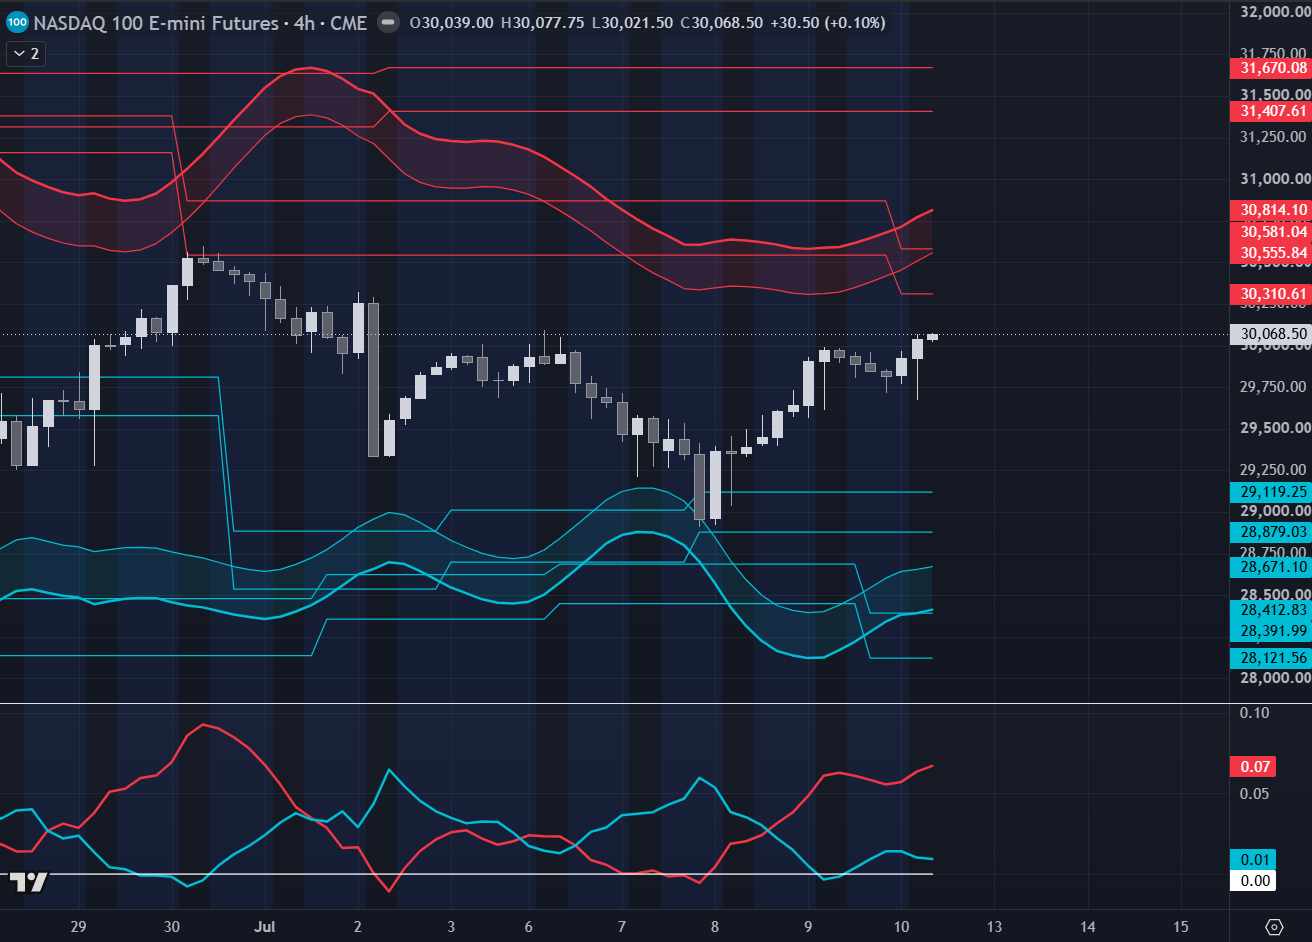
MetaSwing tracks confirmed historical volatility peaks and troughs, projecting them forward across your chart. These zones give you a clear map of exactly where price will likely pause or reverse — hours, days, or even weeks in advance.

Pricing

Start with 30 days free. Decide after.

Full platform on every plan. Cancel anytime during the trial — no charges, no friction.

Active Trader · Monthly

Monthly access

$150/ month

For the discretionary trader who wants flexibility. Cancel any time.

  • Live MetaSwing N Bands
  • Forward-projected PIV zones
  • Structural trend-change markers
  • ATR-driven Risk-Reward Engine
  • All markets · all timeframes
  • Email support
Start your trial

No credit card required to start your 30-day trial · Cancel any time

FAQ

Frequently asked questions.

VBSR stands for Volatility-Based Support Resistance. It is a proprietary methodology that projects future support and resistance levels using volatility extremes.
Traditional technical analysis focuses primarily on price movement and trend lines. MetaSwing focuses on volatility behavior, implied volatility, and institutional market structure.
MetaSwing is designed for active traders, analysts, portfolio managers, options traders, and quantitative market participants.
Yes. The methodology is designed to be timeframe agnostic and adaptable across intraday, daily, weekly, and longer-term analysis.
Yes. MetaSwing includes implied volatility analysis concepts that can assist with options positioning, volatility mean-reversion analysis, and strategy selection.
Both. The framework can support discretionary trading workflows as well as quantitative and systematic analysis.

Put institutional-grade volatility analytics in your corner.

Start your trial with full platform access. See support, resistance, trend, and implied volatility the way institutions do.

Start your trial Contact MetaSwing